Watch it in the product
A tour of OpexMX reporting: the MTBF and MTTR dashboard, the dashboard gallery, the reports hub, the A4 report designer and a work record rendered as a PDF.
Find it: Analytics in the sidebar (Insights section): Overview, Personnel Performance, Parts Stock, Asset Status Segments, Reliability (MTBF/MTTR) and Site Comparison. Custom dashboards, report templates, KPI benchmarks and scheduled reports are under Reports.
Sound familiar?
- "How's maintenance performing this month?"
- "Which assets are causing the most downtime?"
- "Who on the team needs coaching, and who deserves credit?"
Analytics turns the tickets, status changes and stock movements your team already records into a few fixed dashboards. Nothing to configure: open a page and the numbers come from live data. For your own views, use the Dashboard Builder; for printable documents, the Report Builder.
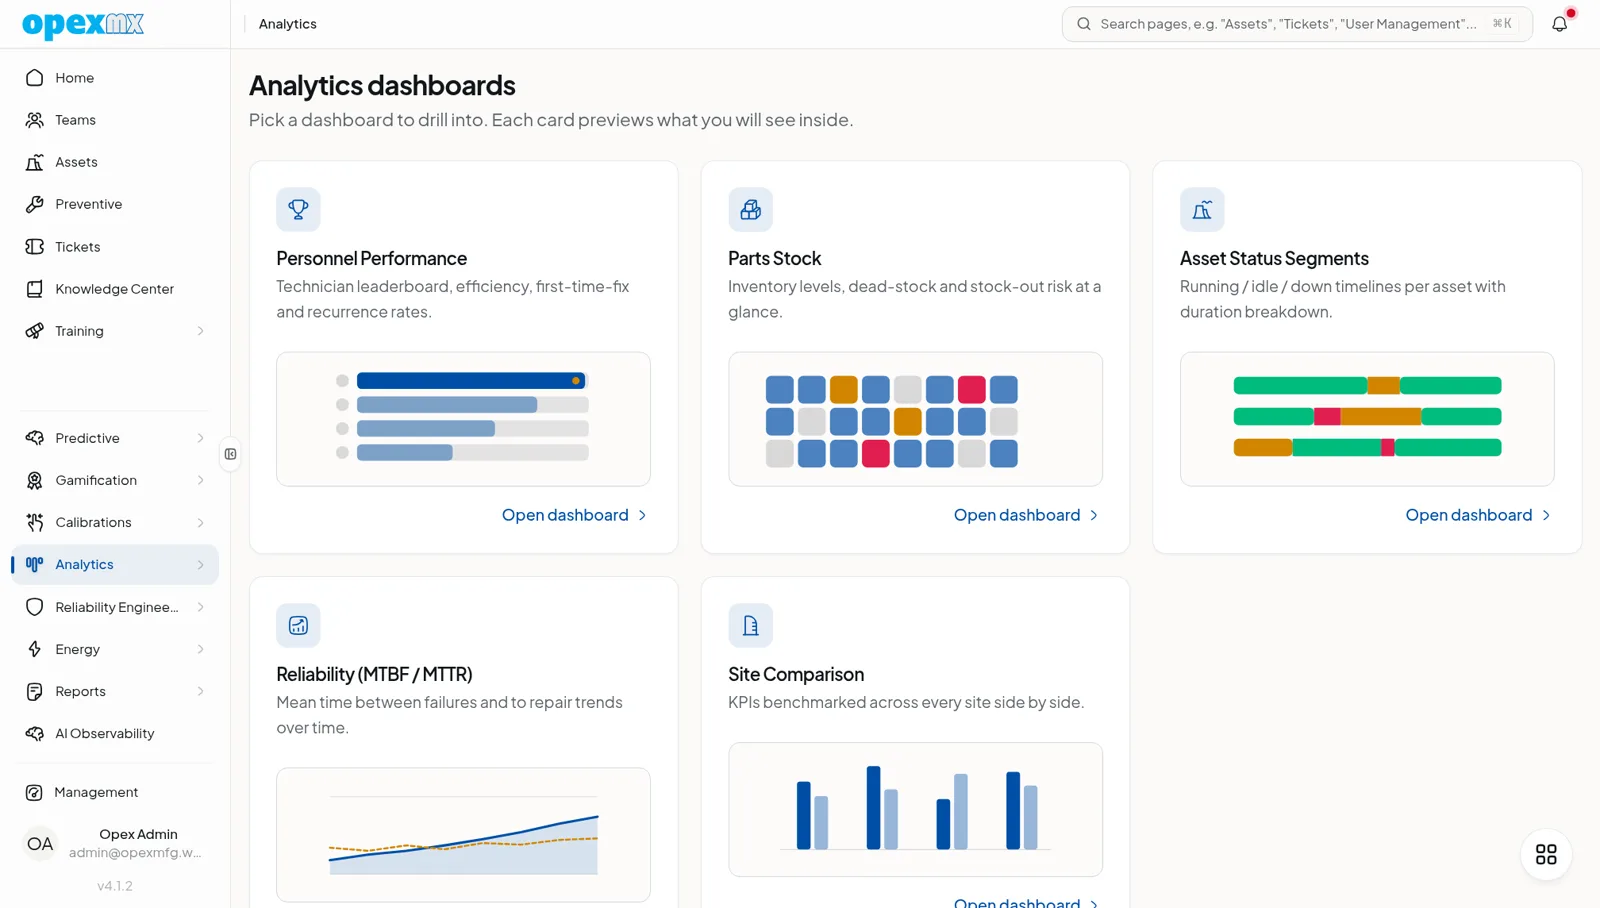
The Analytics Dashboards
The Overview page shows one card per dashboard with a small preview of what is inside.
| Dashboard | What it answers |
|---|---|
| Reliability (MTBF/MTTR) | How often each asset fails, how long repairs take, and its availability |
| Asset Status Segments | When each asset was running, idle or down, on a timeline |
| Personnel Performance | Who fixes fast and right the first time, who needs training or a closer look |
| Parts Stock | Which parts tie up money, which are dead stock, which risk running out |
| Site Comparison | How sites compare on assets, parts, users, tickets and completion rate |
Reliability (MTBF/MTTR)
Pick a start and end date and time. The page shows:
- Overall MTBF: total uptime ÷ number of failures (higher is better)
- Overall MTTR: total downtime ÷ number of repairs (lower is better)
- Overall Availability: MTBF ÷ (MTBF + MTTR) × 100%
- Reliability Trend Over Time: MTBF and MTTR lines across the period
- Asset Reliability Details: a row per asset with failures, tickets, availability and a status
Assets are rated by availability: Excellent at 90% or more, Good at 75–89%, Poor below 75%. Uptime and downtime come from asset status changes, so the numbers are only as good as the status your team records when a machine stops and restarts.
Asset Status Segments
Choose one or more assets and a date range to see a colored timeline of their status, one bar per status period. Hover a segment for its start, end and duration. The Status Summary adds up total time and share per status, which is the quickest way to answer "how long was the filler line down last week?"
Personnel Performance
Two tabs, each covering the last 30 days:
- Corrective: tickets, average time to repair (TTR), response time, first-time-fix (FTF) rate, recurrence rate and an efficiency score per technician
- Preventive: PM tasks, response time (assigned to in progress), and duration accuracy (actual checklist time against the template's estimate)
Cards at the top group technicians into Needs Training (slow fix times), Needs Evaluation (response or workload issues) and Top Performers.
How the numbers work:
- Efficiency score (corrective): 40% on-time completion, 30% first-time fix, 30% response time. Corrective tickets carry no time estimate, so a technician with only corrective work is scored 50% first-time fix and 50% response time.
- Efficiency score (preventive): 50% response time, 50% duration accuracy.
- Recurrence: a completed ticket counts as a recurrence when a ticket of the same type, with similar keywords, comes back on the same asset within one day. Lower is better.
Parts Stock
A Value vs. Uncertainty matrix plots every part as a bubble: usage rate across, demand volatility up and down, and bubble size for inventory value. Parts in the high-value, volatile corner are the ones to review first. The page also shows:
- ABC (value) and XYZ (demand variability) classification per part
- Parts below safety stock or below reorder point
- An Inactive Stock Alert with the total value of slow-moving parts (no use for 90 days) and dead stock (no use for 180 days)
Usage compares the last 30 days against the 90 days before. To act on the results (reorder points, safety stock), see Inventory Optimization.
Site Comparison
One table, one row per site: asset count, parts, users, tickets, completed tickets and completion rate. Useful when several plants share one OpexMX workspace.
Exports
| Page | Export | Formats |
|---|---|---|
| Reliability (MTBF/MTTR) | Asset Reliability report for the selected date range | PDF, Excel (XLSX), CSV |
| Personnel Performance | Team Performance report for the last 30 days | PDF, Excel (XLSX), CSV |
Exports run in the background and download when ready. Every export is listed under Reports → Scheduled → History.
The Reports Menu
| Item | What it does |
|---|---|
| Dashboards, AI Dashboard Builder | Your own dashboards from live data, built by hand or described to AI. See Dashboard Builder |
| AI Report Builder, Report Designer, Report Viewer | Printable PDF templates bound to a ticket. See Report Builder |
| KPI Benchmarks | Your KPIs against world-class, good and average bands |
| Scheduled | Reports emailed on a daily, weekly or monthly schedule, plus export history |
KPI Benchmarks
Fourteen maintenance KPIs, each with world-class, good, average and poor bands, and your own value for the last 90 days where OpexMX has the data to compute it:
| Computed from your data | Shown as a reference band only |
|---|---|
| Availability, MTBF, MTTR, unplanned downtime, PM compliance, work order completion rate, schedule adherence, planned vs corrective ratio | OEE, performance, quality rate, inventory turnover, stockout rate, maintenance cost as % of replacement asset value |
The reference-only KPIs need production counters, cost data or asset replacement values that OpexMX does not hold, so their cards show the bands with "—" for your value.
Scheduled Reports
Create a schedule with a name, the report to send, the format (PDF, Excel or CSV), the frequency (daily, weekly or monthly), a time and a comma-separated list of email recipients. The report covers the last day, 7 days or 30 days to match the frequency, and arrives as an email attachment. Schedules can be switched off without deleting them, and the History tab lists every report generated.
The delivery time is in UTC: 09:00 means 16:00 in Jakarta (WIB). Email must be set up for your workspace (see Email & Push Notifications).
Who Can Do What
| Permission | Allows |
|---|---|
report.read | See the Analytics and Reports menus, KPI benchmarks, schedules and history |
analytics.read | Load the data on the Analytics dashboards |
report.export | Download PDF, Excel and CSV exports |
By default, Admins and Supervisors have all three. Technicians, Operators and Warehouse staff have report.read (Warehouse also has report.export) but not analytics.read; Engineers have analytics.read but not report.read. Give a role both report.read and analytics.read if its members should use the Analytics pages. Adjust it per role in User Management.
AI agents connected through the MCP server can read the same figures with tools such as mtbf_mttr, personnel_performance, downtime_stats and bad_actors.
Getting Started
- Record asset status changes when machines stop and restart; MTBF, MTTR and availability are calculated from them
- Open Reliability (MTBF/MTTR) for last month and sort out the assets rated Poor
- Check Personnel Performance with your supervisors and agree on who gets training first
- Review the Inactive Stock Alert on Parts Stock before the next purchasing round
- Schedule the reports your managers ask for every week instead of exporting them by hand
Tips
- Close tickets with accurate start and finish times: TTR, response time and first-time-fix rate are only as good as the timestamps behind them
- Read a low efficiency score together with the ticket count: a technician who takes the hardest breakdowns may score lower than one who handles quick jobs
- Use Asset Status Segments to check a single bad week before trusting a monthly MTBF figure
- Compare KPI Benchmarks quarter to quarter rather than against world-class on day one: the trend matters more than the band
Related
- Dashboard Builder: build your own dashboards, by hand or with AI
- Report Builder: printable PDF templates for tickets
- Reliability Engineering: Weibull analysis, bad actors and root cause work
- Inventory Optimization: act on the Parts Stock findings
- Ticketing System: where the time and failure data comes from
- Gamification: points and leaderboards for the same work