Report Builder
Find it: Reports → AI Report Builder, Report Designer, and Report Viewer in the sidebar.
Sound familiar?
- "The auditor needs a report by 5 — and it's 4."
- "Every site wants the same report with their own header."
- "Recreating this PDF layout by hand every month is soul-destroying."
Reports shouldn't be a craft project every time.
The Problem
Report requests are urgent, repetitive, and slightly different each time. Building them by hand in a desktop tool doesn't scale, and static templates can't adapt to the question actually being asked.
What OpexMX Report Builder Does
Turns a prompt, a screenshot, or an existing PDF into a clean, branded report — and gives you a visual designer for the templates you reuse.
Three Ways to Build
- AI Report Builder — describe what you need in plain language, attach a photo of a layout, or clone an existing PDF. The AI emits content blocks (headings, paragraphs, lists, tables, images); a layout engine positions them on the page. The model never picks coordinates — geometry is deterministic, so output is stable.
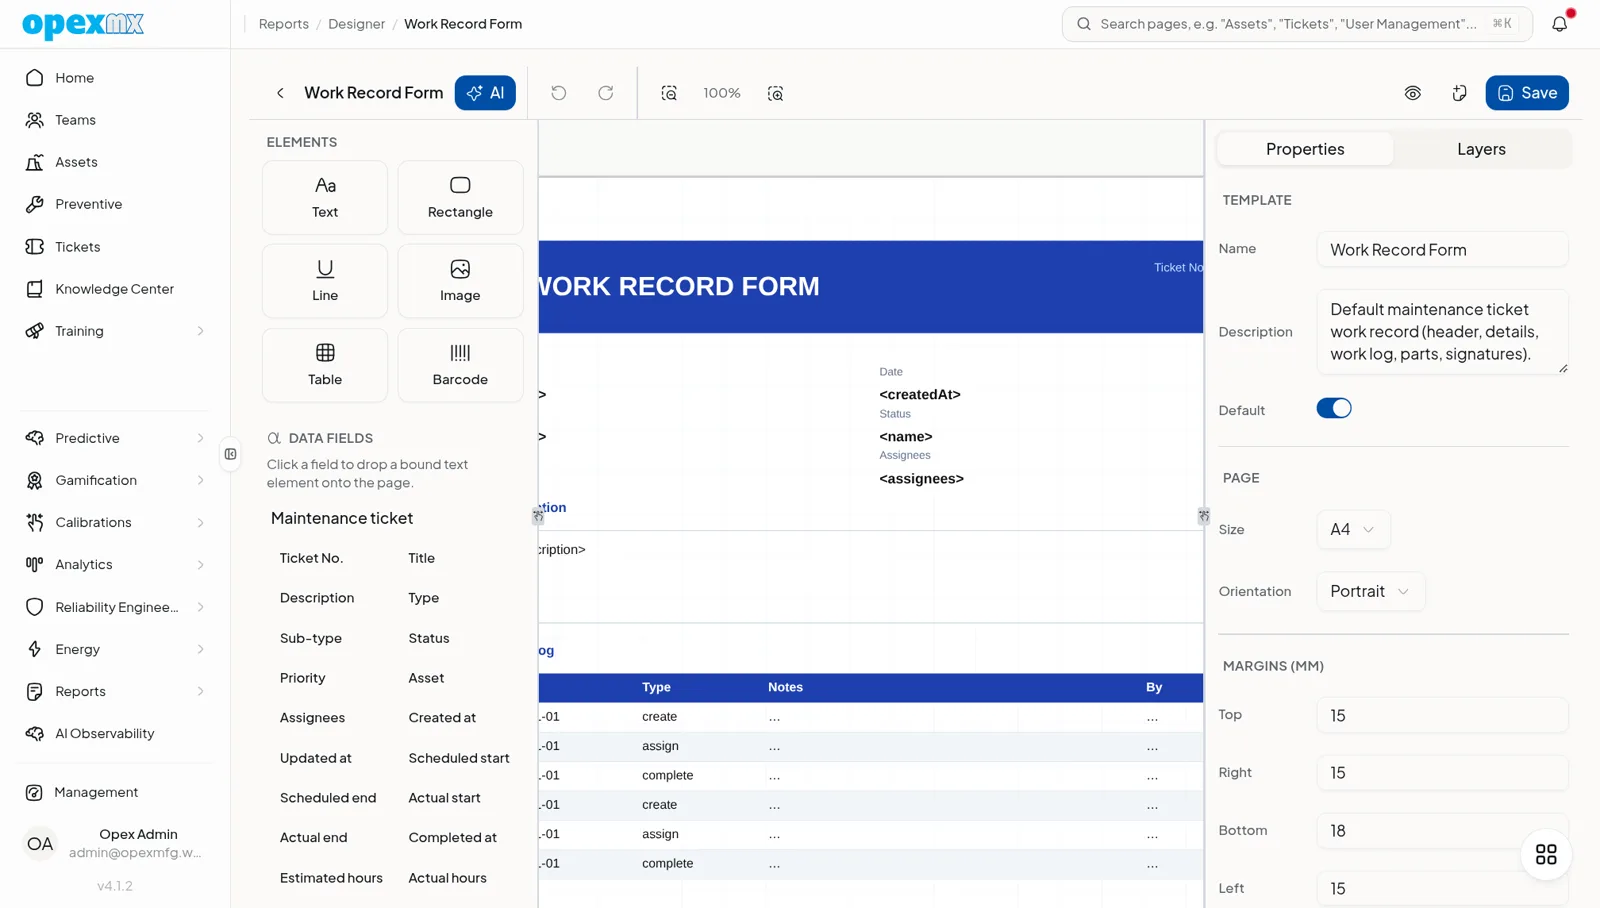
- Report Designer — a canvas editor for reusable templates: place elements, bind them to data (
{{ticket.*}},{{calibration.*}},{{checklist.*}}), add barcodes and images. AI co-edits the live template with you over a streaming session. - Report Viewer — shareable, read-only PDF preview; the bare URL is shareable, and a ticket binds the data.
Real Export Formats
pdf, csv, xlsx — validated at generation, with correct MIME types.
Templates
Ships with static templates (OEE, Downtime, PM Compliance, Cost, Production, Inventory) plus your own DB-backed designer templates.
Scheduled Reports
Set a schedule (daily / weekly / monthly, time, day), pick recipients and format, and reports generate and email automatically. History records every run.
KPI Benchmarks
Fourteen KPIs (OEE, MTBF, MTTR, PM compliance, and more) with world-class / good / average / poor bands, so your numbers have context.
How It Works
- Pick a path: AI builder for one-offs, Designer for reusable templates, or generate from a built-in template.
- Bind data — elements reference ticket, calibration, or checklist fields.
- Render to PDF (or CSV/XLSX) — A4, standard fonts, vector geometry.
- Deliver — download, view the shareable PDF, or schedule it to email.
Who Uses This?
| Role | What They Care About |
|---|---|
| Managers | Branded, on-demand reports without the busywork |
| Auditors | Consistent, reproducible output |
| Planners | Scheduled PM-compliance and cost reports |
| Reliability | OEE / MTBF / MTTR with benchmark context |
Pro Tips
- Use the AI builder for ad-hoc asks; move anything you rerun monthly into a Designer template.
- Bind elements to fields, not hard-coded values — templates stay reusable.
- Add KPI benchmarks to reliability reports so numbers aren't read in a vacuum.
- Schedule the recurring few; don't hand-run them.
Integrations
- Tickets / Calibrations / Checklists: data bindings feed every element
- Dashboards: dashboards double as report sources
- Notifications: scheduled reports deliver over email