Watch it in the product
How machine data reaches OpexMX: parameters and units defined per asset, a telemetry connector registered with its own API key and ingest endpoint, and the connector's health in the list.
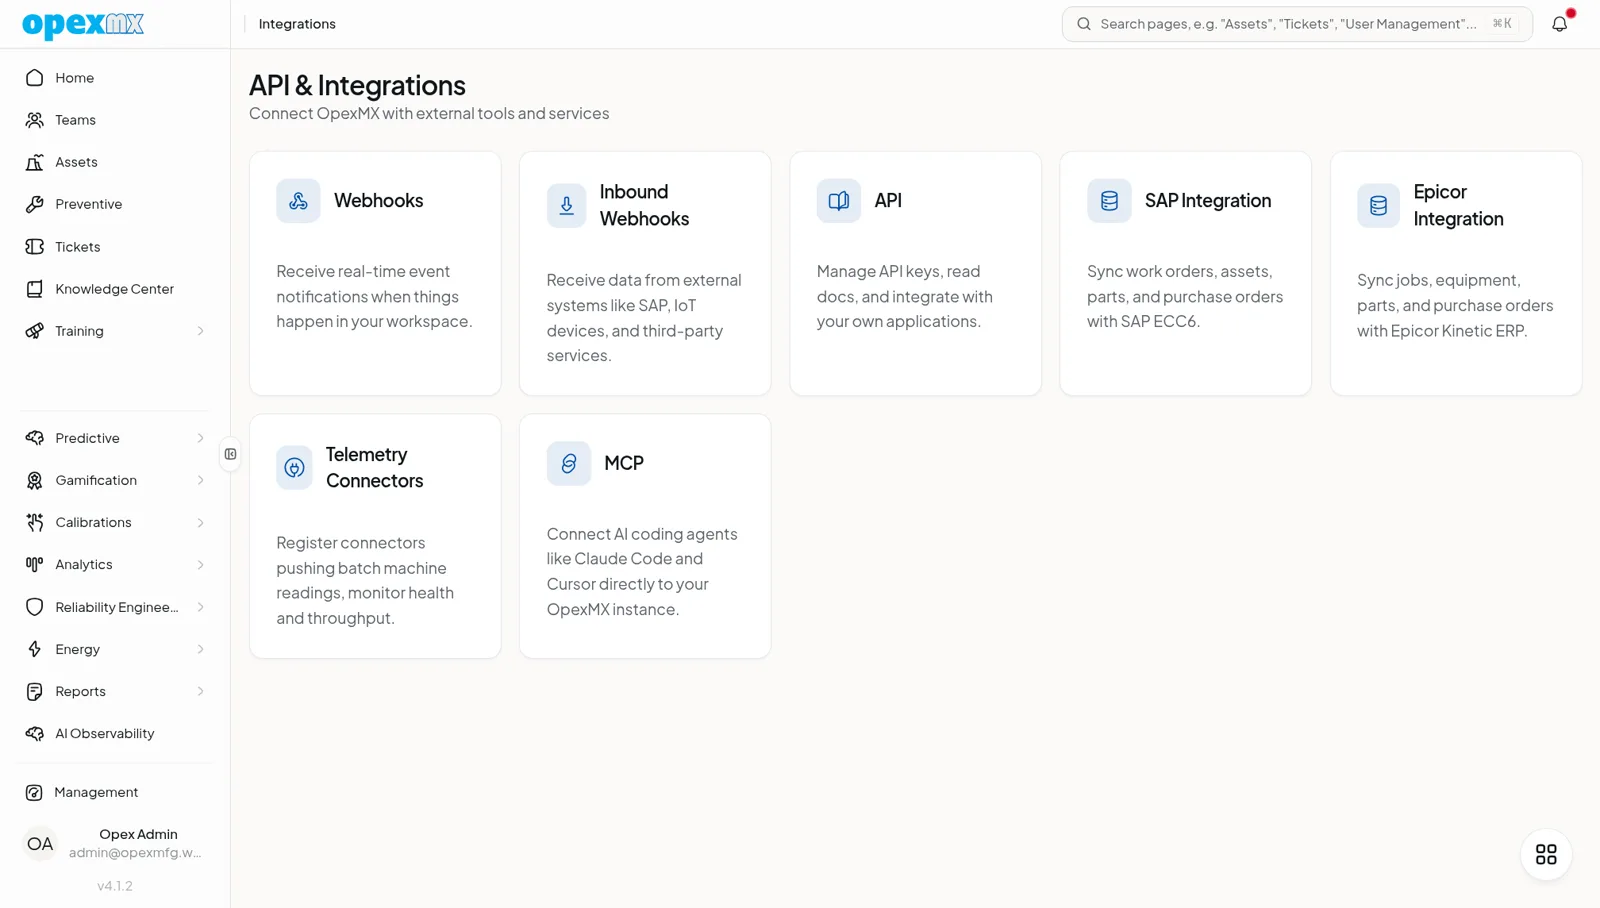
Find it: Management → API & Integrations → Telemetry Connectors (Admin group) to register connectors and map tags. Parameters and units are under Management → Parameter Management (Assets group).
Sound familiar?
- "The PLC knows the motor is running hot. The maintenance team finds out when it trips."
- "Someone walks the line twice a shift to write down pressures on a clipboard."
- "We have a historian full of data that nobody in maintenance can see."
OpexMX takes readings from your machines and stores them against the right asset parameter, where they drive health scores, alerts, trend forecasts, ticket rules and dashboards. The data arrives through a registered telemetry connector: the OpexFlow edge connector on the plant floor, the vibration edge on a rotating machine, or a gateway you already run. Each connector has its own API key, its own tag mappings and its own health figures, so you can see at a glance which line has gone quiet.
Ways to Connect
| Path | Use it when | What it sends |
|---|---|---|
| OpexFlow edge connector | You need to read PLCs, SCADA, CNCs or sensors on the plant network | Batches of readings to the telemetry endpoint |
| Vibration edge | You monitor bearings, gearboxes, pumps and fans with a vibration sensor | Fault probability and FFT spectra per measurement window |
| Your own gateway or historian | You already collect the data (Node-RED, a historian export, a SCADA script) | Batches of readings to the telemetry endpoint, in the same format |
| Manual entry | Readings come from operator rounds | Values typed in the web or Field app |
The connector always pushes out to OpexMX over HTTPS. Nothing in your plant has to accept inbound connections.
Before You Start
Readings are stored against asset parameters, and OpexMX never creates parameters from incoming data: a reading for a tag that resolves to no parameter is rejected and listed, not guessed. So first:
- Assets exist with codes (for example
CMP-02for a compressor) in Asset Management - Units and parameters are defined in Parameter Management: tabs Parameter Units (for example °C, bar, mm/s), Parameters (bearing temperature, discharge pressure) and Asset Parameters, which links a parameter to an asset
- Limits are set for the parameters that matter, as parameter rules in Ticketing ticket rules
Step 1: Register a Connector
In Telemetry Connectors, click Register Connector, give it a name (for example "Packing line edge") and pick a source type:
| Source type | For |
|---|---|
| opex-flow edge | An OpexFlow edge connector |
| Vibration edge | A vibration edge device |
| API key (generic) | Your own gateway or script |
| Manual | A connector record without automated delivery |
OpexMX mints an API key for the connector and shows the ingest endpoint (https://<your-opexmx>/api/rpc/telemetry/batch). Copy the key straight away: it is shown only once. It goes in the connector's configuration as an Authorization: Bearer header.
The person who registers the connector owns its key, and that person's role must hold predictive.iot.ingest. Seed from registries creates connector records for vibration sensors and API keys that already exist.
Step 2: Map Tags to Parameters
Each reading names its asset and a parameter or tag. OpexMX resolves it in this order:
- An explicit asset parameter ID in the reading
- A tag mapping on the connector
- Asset ID plus parameter name
- Asset code plus parameter name
If your PLC tags already match your parameter names, steps 3 and 4 do the work. For historian-style tags (L2.CMP02.TT101.PV), add tag mappings:
- Map tag: one tag → asset → parameter, with an optional unit hint
- Import tag mappings: a CSV or XLSX file with columns
tag,assetCode,parameterNameand an optionalunitHint. A historian tag export usually maps straight across - Observed tags: every tag the connector has sent, with first and last seen and a count, so unmapped tags are easy to spot and map
Step 3: Watch Connector Health
The connector list shows, for each connector:
| Column | Tells you |
|---|---|
| Status / Last seen | Whether it is still sending |
| Readings/hr | Throughput |
| Queue | How many batches the edge has waiting to send |
| Clock offset | How far the edge clock is from OpexMX (wrong clocks put readings at the wrong time) |
| Accepted today / Rejected | Readings stored and refused today |
| Data quality | Share of complete, stale and bad-quality readings |
Refused readings are kept in quarantine with a reason (unknown tag, unit mismatch, out of range, timestamp in the future, and so on) on Condition Monitoring → Data Quality, where they can be released or discarded.
OpexFlow Edge Connector
OpexFlow is our industrial edge connector, licensed separately from OpexMX. It runs as a single binary on a Raspberry Pi, an industrial PC or a server, reads your equipment, keeps a local copy and pushes to OpexMX.
| Source | Reads from |
|---|---|
| Modbus TCP and RTU | PLCs, VFDs, energy meters, sensors |
| OPC-UA | SCADA, Siemens, Allen-Bradley and other OPC-UA servers, polled or subscribed |
| EtherNet/IP | Rockwell / Allen-Bradley controllers |
| MQTT | IoT sensors and other devices publishing to a broker |
| MTConnect | CNCs with an MTConnect agent (Fanuc, Haas, Siemens) |
| Fanuc FOCAS | Fanuc CNCs: run state, axis positions, spindle speed, alarms |
It keeps data in local SQLite (7 days by default), retries with a durable queue when the network drops, and has a browser-based flow editor and live view on the edge device. Full reference: OpexFlow documentation.
To send to OpexMX, use the batch format opexmx with the key and endpoint from Step 1:
connector:
  name: packing-line-edge
  push_queue:
    enabled: true            # required for batching
  batch:
    enabled: true
    format: opexmx
    endpoint: https://<your-opexmx>/api/rpc/telemetry/batch
    api_token: ${OPEXMX_CONNECTOR_KEY}
    max_records: 100
    flush_interval_secs: 5
OpexFlow uses each device's id as the asset code, so name devices after your OpexMX asset codes (or map their tags in Step 2).
Vibration Edge
The vibration edge runs on a small computer next to the machine, analyses each measurement window and posts the result to OpexMX: a fault probability from the vibration model and, in FFT mode, the spectrum. Register the sensor under Condition Monitoring → Vibration Monitoring with the asset it watches. Registration returns the sensor's API key once; the key is bound to that one sensor, and each key may send up to 120 requests per minute.
OpexMX classifies the level against ISO 20816 zones, flags fault frequencies, raises an alert after a run of fault windows (3 by default) and can open a ticket automatically. See Condition-Based Monitoring. To add delivery guarantees and thinning between the edge and OpexMX, put OpexFlow in between (guide).
Your Own Gateway: the Telemetry API
Any system that can make an HTTPS request can send readings. Register a connector with source type API key (generic), then:
POST /api/rpc/telemetry/batch
Authorization: Bearer mx_...
Content-Type: application/json
{
  "sequence": 1842,
  "metadata": { "sentAt": "2026-03-04T07:24:20+07:00" },
  "readings": [
    { "assetCode": "CMP-02", "parameter": "discharge_temperature", "value": 96.4, "unit": "°C", "timestamp": "2026-03-04T07:24:15+07:00" },
    { "assetCode": "CMP-02", "parameter": "discharge_pressure", "value": 7.8, "unit": "bar", "timestamp": "2026-03-04T07:24:15+07:00" }
  ]
}
| Field | Notes |
|---|---|
sequence | Increasing number per connector. A batch with a sequence already received is acknowledged as a duplicate and not stored twice, so retries are safe |
readings[] | Up to 5,000 per batch. Each needs parameter, value, timestamp and one of assetCode, assetId or assetParameterId. unit and quality are optional |
timestamp | ISO 8601 with a time zone offset; stored in UTC |
backfill | true sends history to the training-data landing zone instead of the live tables, so it does not fire alerts or ticket rules |
metadata.sentAt | The sender's clock at send time; used to measure clock offset |
The response says how many readings were inserted and rejected, with the reason for each rejected one (up to 100 listed), plus the measured clock offset.
Limits
| Limit | Default |
|---|---|
| Batches per connector | 60 per minute (HTTP 429 above that) |
| Readings per batch | 5,000 |
| Readings per connector per day | 10 million |
Live batches are checked against ticket rules as they arrive, and the asset's health score is refreshed within minutes.
Security
- Each connector has its own API key; deactivating the connector disables the key
- Keys are checked against the tenant, so a key from one OpexMX workspace cannot write to another
- Connections are outbound only, from your network to OpexMX over HTTPS
- Every reading is screened before it is stored, and refusals are kept for review rather than dropped
Who Can Do What
| Permission | Allows |
|---|---|
connector.read | See connectors, their health and throughput |
connector.create | Register a connector and mint its API key |
connector.update | Rename a connector or switch it on and off |
connector.delete | Deactivate a connector and disable its key |
connector.mapping.read | See tag mappings and observed tags |
connector.mapping.create / update / delete | Add, import, change and remove tag mappings |
predictive.iot.ingest | Needed by the key owner for data to be accepted |
parameter.read / create / update / delete | Manage parameters in Parameter Management |
By default, Admins have all of these. Supervisors can also see connectors and tag mappings. Supervisors and Engineers hold predictive.iot.ingest, so they can own connector keys, and can create and edit parameters. Adjust roles in User Management.
Getting Started
- Pick one machine with data you already trust, such as a compressor with a PLC
- Define its parameters and units in Parameter Management and link them to the asset
- Register a connector and copy the key
- Configure OpexFlow (or your gateway) with the key and endpoint, and name the device after the asset code
- Check Observed tags after a few minutes and map anything unmapped
- Set a limit on one parameter as a ticket rule and watch the trend in Condition Monitoring
Tips
- Keep edge clocks on NTP: the clock offset column shows drift before it skews your trends
- Send units with readings; a mismatched unit is quarantined instead of being stored as the wrong number
- Use
backfillto load a historian export for model training without flooding the alerts inbox - Start with a few parameters per machine (temperature, vibration, current) rather than every tag the PLC exposes
Related
- Condition-Based Monitoring: what OpexMX does with the readings
- Ticketing System: parameter rules that open tickets
- Asset Management: asset codes and parameters
- API & Integrations: API keys, webhooks and the API reference
- OpexMX with SAP through OpexFlow: OpexFlow on the business side