Reliability Engineering
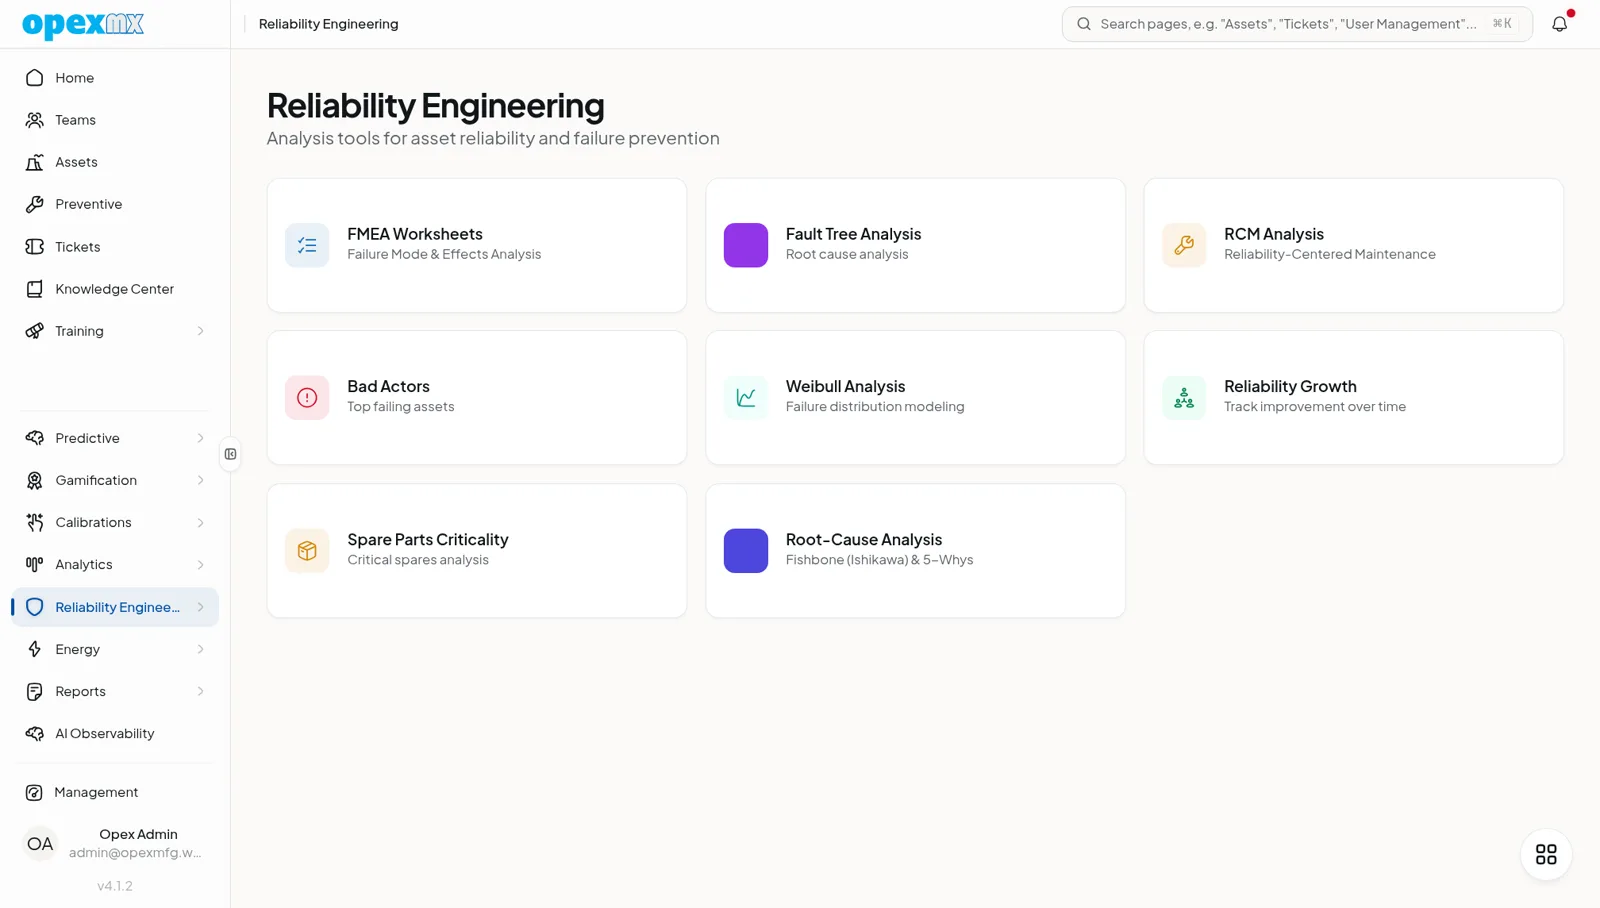
Find it: Reliability Engineering in the sidebar — Bad Actors, Weibull Analysis, Spare Parts Criticality, FMEA, Fault Trees, RCM Analysis, Reliability Growth.
Sound familiar?
- "We fix the same asset over and over, but never ask why."
- "Is this failure mode actually critical? Show me the math."
- "How long until this pump fails again — and should we run it to failure?"
Reactive maintenance fixes symptoms. Reliability engineering eliminates the cause.
The Problem
Gut feel doesn't scale across hundreds of assets. Without structured analysis, criticality is guessed, failure modes are debated endlessly, and PM intervals come from OEM manuals that ignore how you actually run the equipment. Decisions that should be data-driven become opinion battles.
What OpexMX Reliability Engineering Does
Gives you the same toolkit a reliability engineer uses — FMEA, RCM, Weibull, fault-tree, and bad-actor analysis — wired straight into your live maintenance data.
FMEA (Failure Mode & Effects Analysis)
Build worksheets per asset or system, break down each failure mode, and score Risk Priority Number (RPN) = severity × occurrence × detection, each on a 1–10 scale. Use AI-suggested severity/occurrence/detection to bootstrap a worksheet from historical data, then refine. Rank rows by RPN to prioritize where to act first.
RCM (Reliability-Centered Maintenance)
Decide the right strategy per failure mode — preventive, predictive, or run-to-failure — with a documented rationale. Workflows move DRAFT → IN_REVIEW → APPROVED, and an approved RCM analysis can generate PM schedules automatically.
Weibull Analysis
Fit a failure distribution to each asset's history and get the parameters that drive lifetime decisions: shape (β), scale (η), mean time between failures, and goodness-of-fit (r²). Upload your data points, run the regression, and read off expected life and the right intervention interval.
Fault-Tree Analysis
Model the combinations of events that lead to a top failure. Build the tree from gates and basic events, then use it to quantify probability and find the dominant failure path.
Reliability Growth
Track whether your reliability is actually improving over time — growth curves and snapshots show if design fixes and PM changes are moving the needle.
Bad-Actor Ranking
Stop guessing which assets hurt most. The bad-actor report ranks assets by failure count, total downtime hours, MTBF, MTTR, and a computed criticality score — so your reliability budget goes where the data says.
Spare-Parts Criticality
Not every spare matters equally. Rank parts by criticality so stocking decisions (what to keep on the shelf, what to stock-out) are defensible.
How It Works
- Pull live data — failures, downtime, and PM history come from your existing tickets and assets.
- Run the analysis — FMEA, Weibull, RCM, fault-tree, bad-actors compute from that data.
- Decide a strategy — pick preventive, predictive, or run-to-failure per failure mode.
- Act — generate PM schedules from an approved RCM; target the top bad actors.
Who Uses This?
| Role | What They Care About |
|---|---|
| Reliability Engineers | FMEA, Weibull, defensible intervals |
| Maintenance Managers | Bad actors, MTBF/MTTR trends, where to spend |
| Planners | RCM-driven PM generation |
| Operations | Uptime and the cost of failure |
Pro Tips
- Start with bad-actor ranking — it tells you which assets deserve a full FMEA.
- Let AI suggestions bootstrap FMEA scores, then validate with your team.
- Use Weibull to challenge OEM intervals; your operating context is different.
- Approve RCM before generating PMs — the workflow exists to keep decisions auditable.
- Re-run reliability growth quarterly to prove the program is working.
Integrations
- Assets: failure modes and analyses attach to specific equipment
- Tickets: failure history feeds Weibull, FMEA, and bad-actor math
- Preventive Maintenance: approved RCM generates PM schedules
- Analytics: MTBF/MTTR underpin the criticality scores