Condition-Based Monitoring & Predictive Maintenance
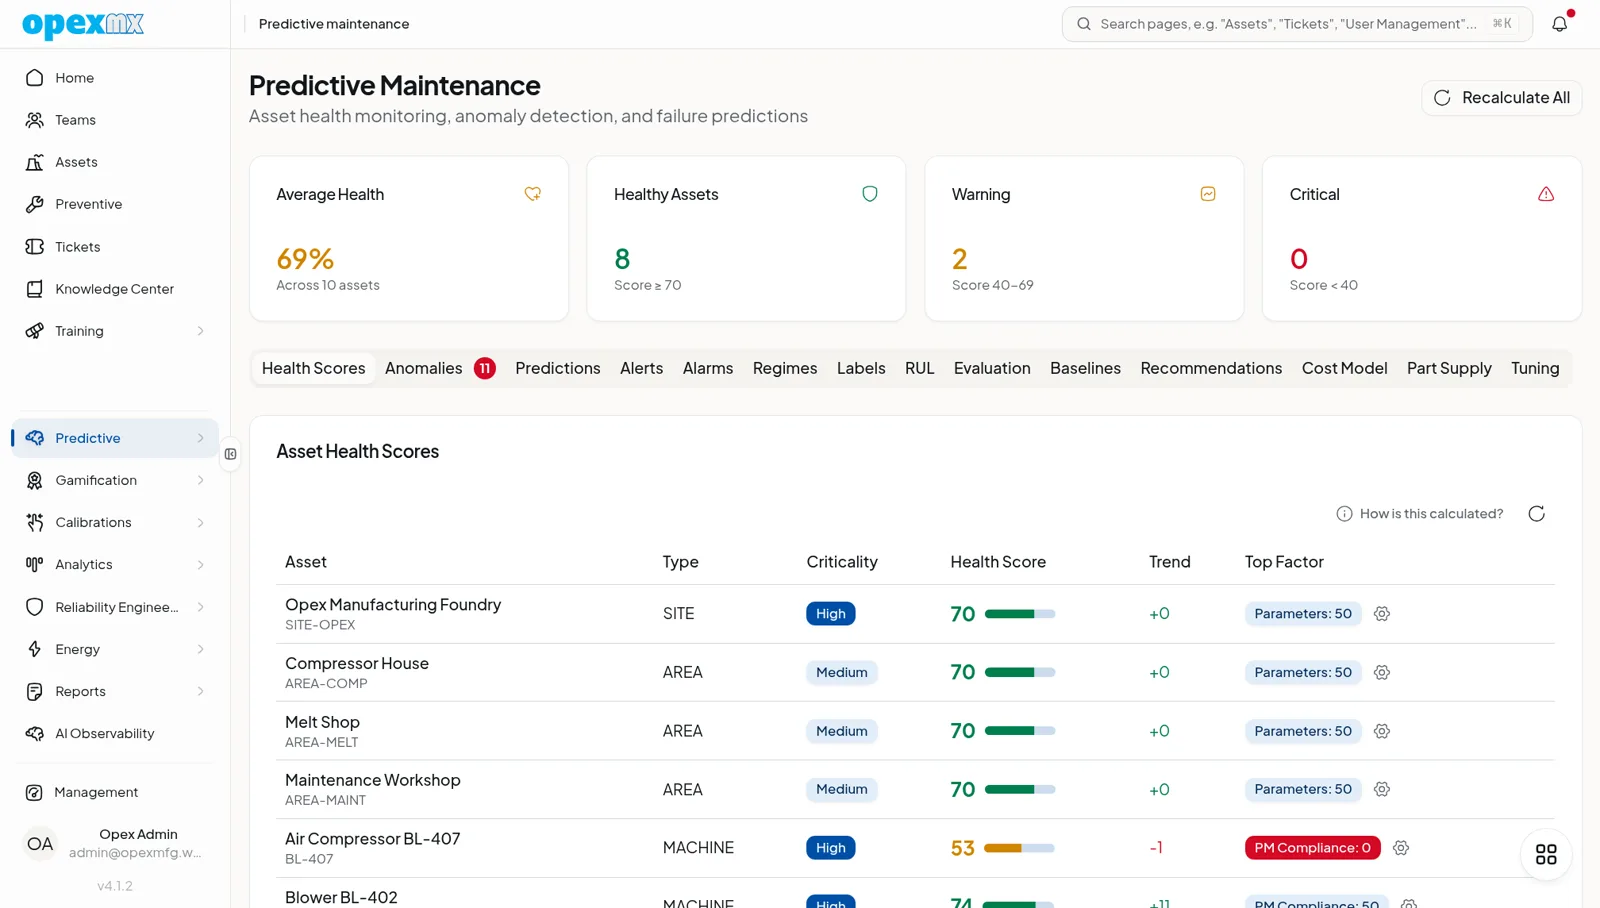
Find it: Predictive in the sidebar — Dashboard, Vibration Monitoring, and Trend Prediction.
Sound familiar?
- "Why did that motor burn out? There was no warning."
- "We replace bearings on a fixed schedule. Some are still good, some fail early."
- "The PLC has all this data. Can't we use it?"
Reacting to failures is expensive. Monitoring conditions and predicting problems saves money.
The Problem
Fixed-interval maintenance means replacing parts that are still good (waste) or missing parts about to fail (breakdowns). Your machines already generate data — OpexMX turns it into maintenance decisions.
What OpexMX Does
Ingests machine data, scores asset health, detects anomalies, predicts remaining useful life, and alerts you before a failure — so you act on condition, not a calendar.
What You Can Monitor
- Temperature — motors, bearings, electrical components
- Vibration — rotating equipment, pumps, fans (FFT, ISO 10816 zone analysis)
- Pressure — hydraulic and pneumatic systems
- Flow — cooling, lubrication, process flows
- Current / load — motor power consumption
- Runtime / cycle count — equipment utilization
Health Score
Every monitored asset gets a composite health score from five weighted factors: parameter degradation (40%), vibration (25%), failure history (25%), PM compliance (20%), and asset age (15%) — renormalized over the factors actually present for the asset.
Anomaly Detection
Define a condition trigger per parameter: a comparison operator (>, <, >=, <=, =, !=), a threshold value, and a trigger type — immediate or sustained (with durationSeconds and cooldownSeconds). Breaches become anomalies with a severity you can act on and dismiss.
Failure Prediction (RUL)
Weibull analysis fits a failure distribution per asset and estimates remaining useful life (shape, scale, median life) — so you plan replacement before failure, not after.
Degradation Curves & Trends
Track how each parameter drifts over time and forecast where it's heading. Trend prediction turns raw history into a forward-looking view per asset parameter.
Vibration Monitoring
A dedicated vibration lane ingests inference payloads (probability, label, per-channel RMS) from a vibration-edge device, classifies against ISO zones, and auto-creates a ticket when a machine crosses into the danger zone.
How Machine Data Gets In
An edge connector (on a Raspberry Pi) reads Modbus TCP, OPC-UA, and MQTT from your machines, and a companion FOCAS agent reads Fanuc CNCs. Both push a normalized payload to OpexMX:
PLC / CNC / Sensor → Edge Connector (Modbus / OPC-UA / MQTT / FOCAS) → OpexMX → Health, Anomalies, Alerts
Two ingestion endpoints, depending on payload shape:
POST /asset-parameter-values
{ "assetParameterId": "MOTOR_TEMP_1", "value": "85" }
POST /predictive-maintenance/asset-data
{
  "assetCode": "PUMP-101",
  "source": "opcua",
  "timestamp": "2025-12-04T07:24:20.069Z",
  "status": { "state": "running", "alarmCode": "", "alarmMessage": "" },
  "values": [
    { "name": "temperature", "value": 85, "unit": "C" },
    { "name": "vibration",   "value": 4.2, "unit": "mm/s" }
  ]
}
Cloud-side data-source types are rest, mqtt, and opcua; Modbus and FOCAS are handled at the edge.
Who Uses This?
| Role | What They Care About |
|---|---|
| Reliability Engineers | Early warning of degradation and RUL |
| Technicians | Insight into what to check first |
| Planners | Data-driven maintenance intervals |
Pro Tips
- Start with critical, high-impact assets.
- Set thresholds from OEM recommendations plus field experience.
- Use sustained triggers with cooldown to suppress false positives.
- Review health-score weights per asset class.
- Route alerts through shift schedules so the right person acts.
Integrations
- Assets: parameters linked to equipment
- Tickets: anomalies and vibration alerts auto-create tickets
- Analytics: trend and degradation analysis
- Preventive Maintenance: adjust intervals from condition